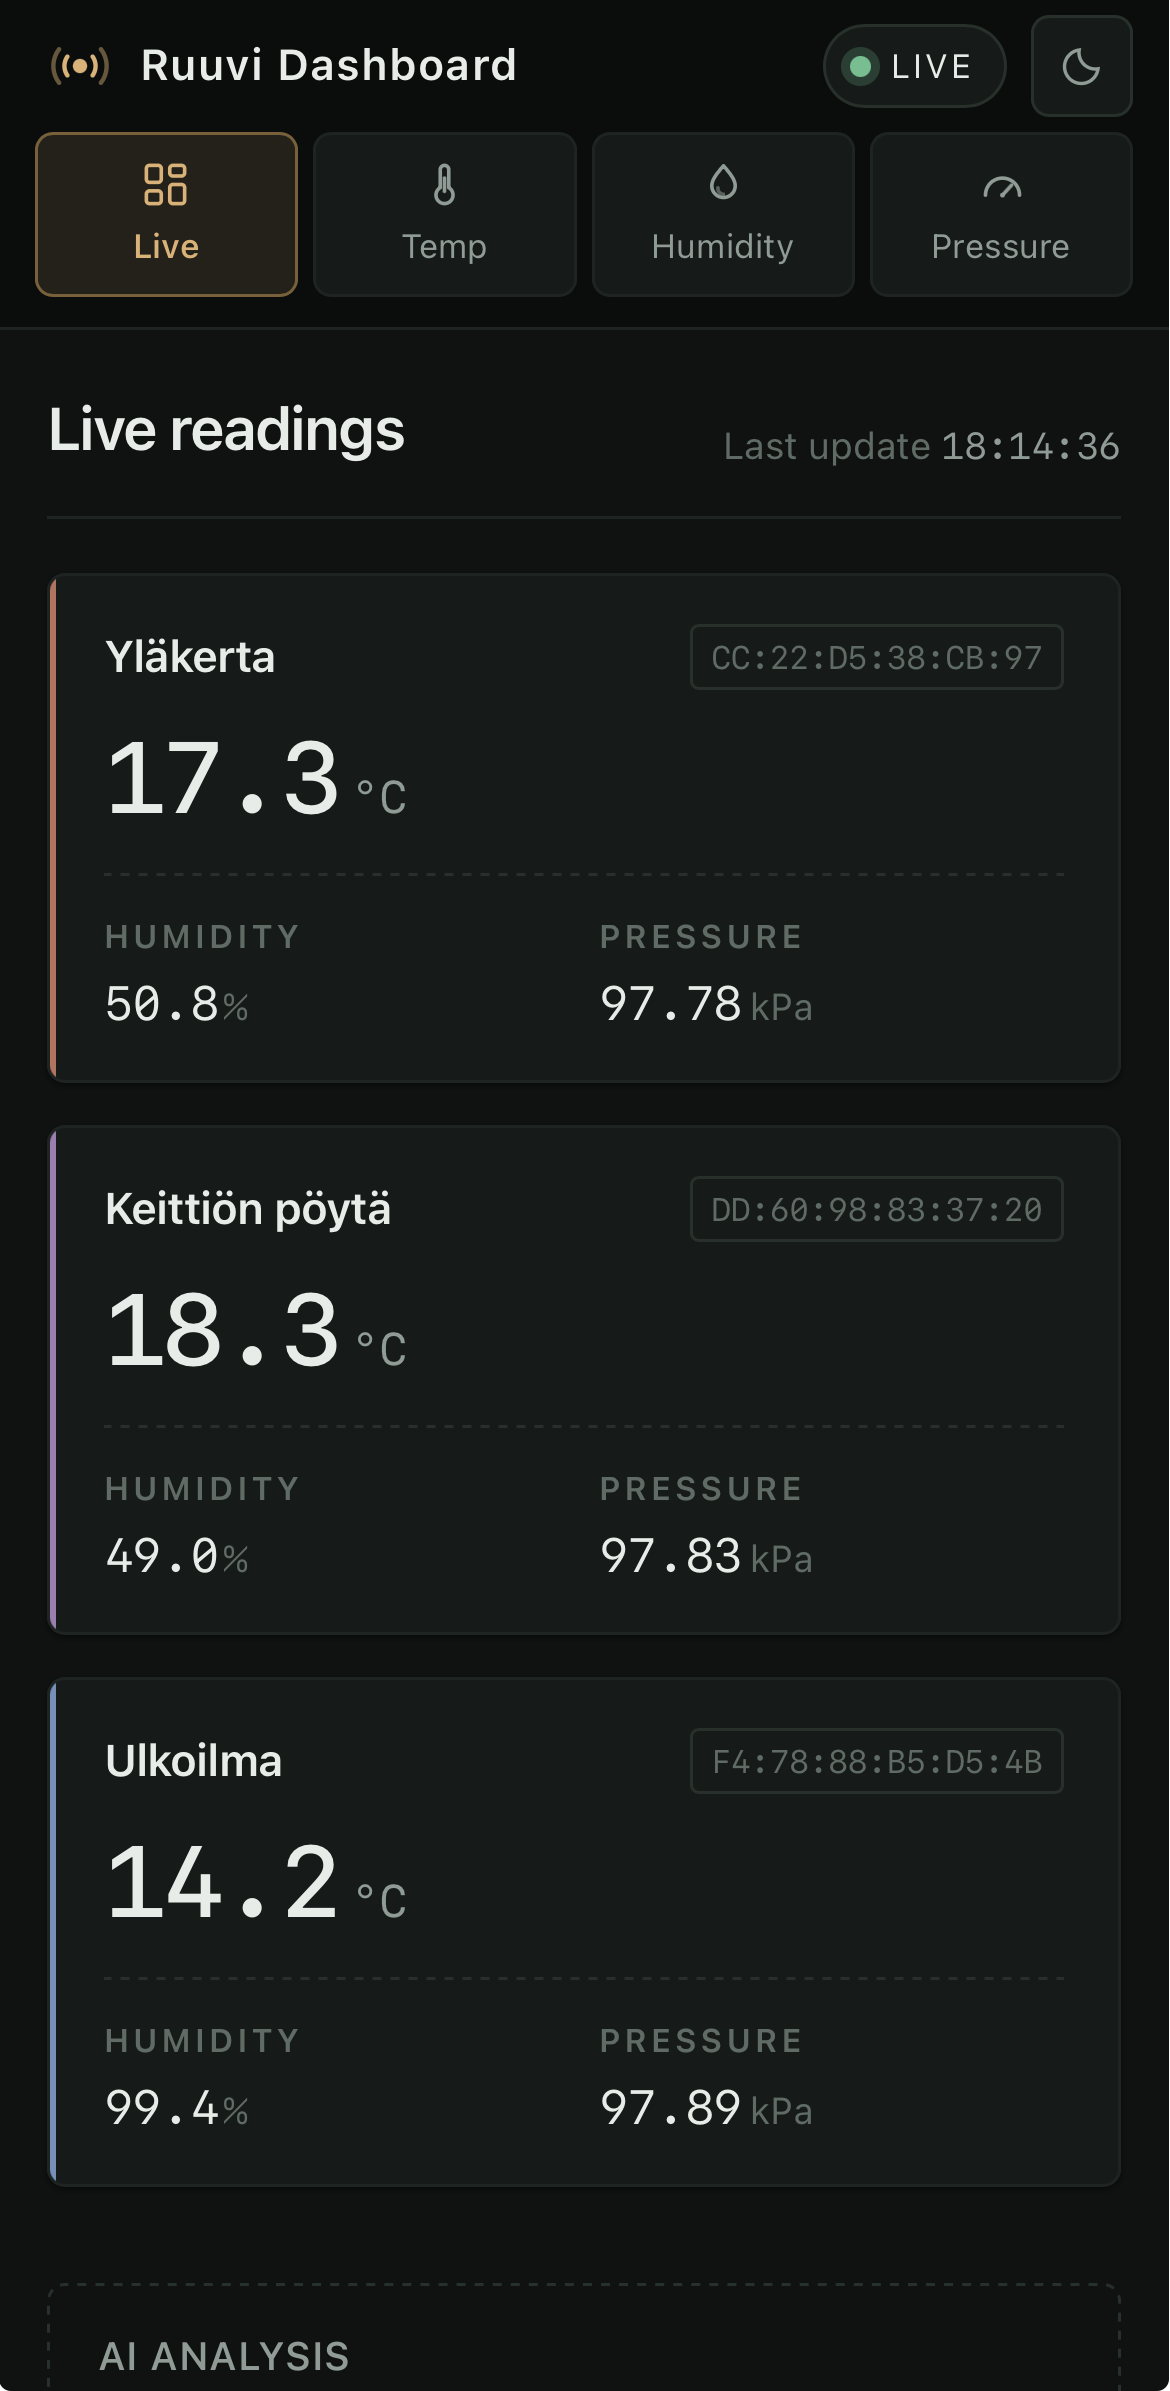
Ruuvi Dashboard
"Why pay for it when I can build it and save money?" I said, not knowing at all how to build it. In fact, I had basically
no programming experience when I first began building this small handy project.
While building it, I faced multiple product design desires that were sorely matched by my complete lack of knowledge.
For example, I thought making the dashboard live update when new data arrives was going to be such a major
undertaking that I wondered whether it was even practical to start implementing it. I kept thinking about it and my
curiosity got the better of me, as it always does. This began my journey of learning about HTTP and websockets,
though at that point I was more focused on getting live updating working than learning about protocols; that only
came once the initial hit of happiness from building something myself and seeing it work got me hooked.
The core of the app is extremely simple. It is just a Python webserver (running Flask) that accepts JSON inputs from
the Ruuvi Gateway, a piece of plastic which collects the signals of local Ruuvi Tag bluetooth sensors and sends the
data to their own managed cloud solution (This is the recommended solution of course), or (if you are a rogue hacker)
to any HTTP address of your choice. The JSON data it sends is then parsed, stored in memory and sent to any clients
along with the HTML once they make a request. After I introduced websockets, this back and forth ping became a stream,
where new data is immediately sent to all connected clients, and the client JavaScript then parses and updates the data.
And of course you want to see the movements in temperatures, so I added a sqlite database and graphs. Now this little
flask server has been reliably reporting the weather developments for almost 2 years.
Recently, I though to myself: "what is a perfectly good weather dashboard missing?" The answer was obvious. AI. I had
played around with different APIs like google's free developer API and Azure vision for analyzing small datasets and
creating structured outputs with image inputs, but I hadn't thought to bring the future into my little dashboard app. Now,
it gives me an analysis of weather data at any interval, identifying deviations and trends. Not that it will see heavy usage,
but it is a good reminder that you can have fun when you choose to build it yourself.
I wonder what I'll add next...
no programming experience when I first began building this small handy project.
While building it, I faced multiple product design desires that were sorely matched by my complete lack of knowledge.
For example, I thought making the dashboard live update when new data arrives was going to be such a major
undertaking that I wondered whether it was even practical to start implementing it. I kept thinking about it and my
curiosity got the better of me, as it always does. This began my journey of learning about HTTP and websockets,
though at that point I was more focused on getting live updating working than learning about protocols; that only
came once the initial hit of happiness from building something myself and seeing it work got me hooked.
The core of the app is extremely simple. It is just a Python webserver (running Flask) that accepts JSON inputs from
the Ruuvi Gateway, a piece of plastic which collects the signals of local Ruuvi Tag bluetooth sensors and sends the
data to their own managed cloud solution (This is the recommended solution of course), or (if you are a rogue hacker)
to any HTTP address of your choice. The JSON data it sends is then parsed, stored in memory and sent to any clients
along with the HTML once they make a request. After I introduced websockets, this back and forth ping became a stream,
where new data is immediately sent to all connected clients, and the client JavaScript then parses and updates the data.
And of course you want to see the movements in temperatures, so I added a sqlite database and graphs. Now this little
flask server has been reliably reporting the weather developments for almost 2 years.
Recently, I though to myself: "what is a perfectly good weather dashboard missing?" The answer was obvious. AI. I had
played around with different APIs like google's free developer API and Azure vision for analyzing small datasets and
creating structured outputs with image inputs, but I hadn't thought to bring the future into my little dashboard app. Now,
it gives me an analysis of weather data at any interval, identifying deviations and trends. Not that it will see heavy usage,
but it is a good reminder that you can have fun when you choose to build it yourself.
I wonder what I'll add next...